Tired of Console Logs? Meet Angular’s Signal Graph
Debugging signal dependencies in Angular applications is challenging without visibility into signal relationships and update chains. Angular 20.1 introduced the Signal Graph debugging tool, providing visual representation of signal dependencies, update flows, and reactive relationships. This tutorial demonstrates how to install and use the Signal Graph to understand your application's reactive architecture, debug signal issues, and optimize signal-based code.
The Problem: Debugging in the Dark
As Angular developers we’re often left wondering:
- When you click a button, which components update?
- Which signals recalculate?
- What’s the order of operations?
Up until now, we’ve had to rely on console logs, breakpoints, and a lot of guesswork. But not anymore.
Let’s check it out!
Install Angular DevTools and Enable the Signal Graph
First, you’ll need Angular DevTools.
If you don’t already have it, grab it from the Chrome Web Store or Firefox Add-ons.
Just search for “Angular DevTools” and hit install.
Once installed, open your app in development mode, head into your browser’s DevTools, and select the “Angular” tab:
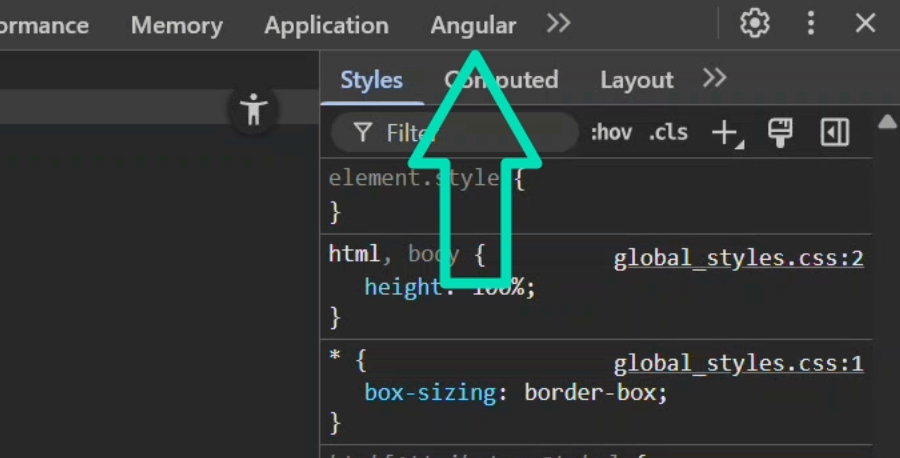
If you don’t see the Angular tab, make sure you’re running your app in development mode, not production.
Because the Signal Graph is still experimental, you’ll need to enable it in the settings menu:
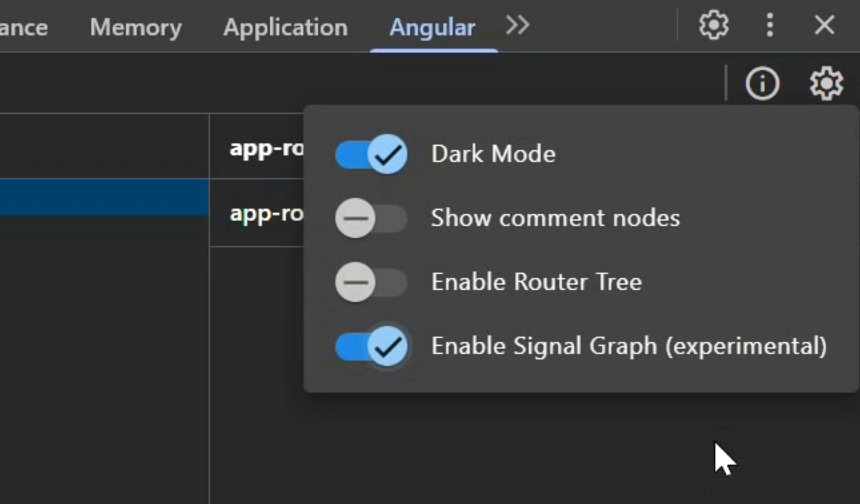
Once that’s done, you’re ready to go.
Using the Signal Graph
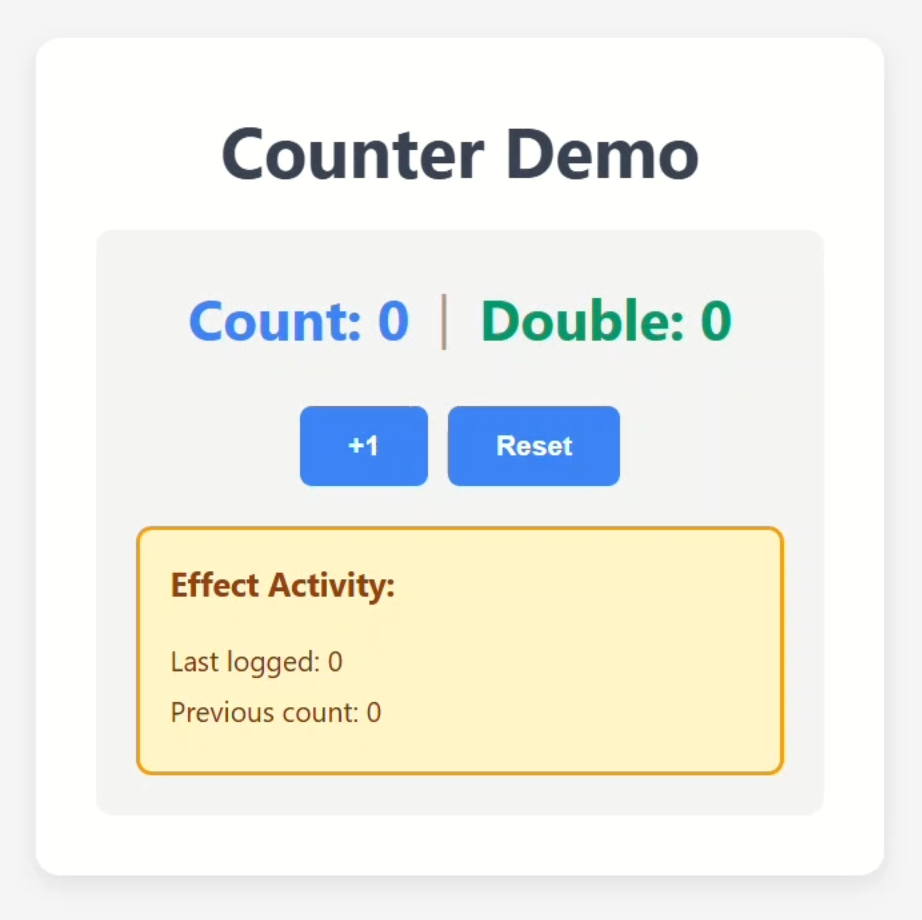
Let’s look at the simple counter app that I created for this tutorial:
To use the Signal Graph, you’ll first need to select the component that you want to inspect in the tree:
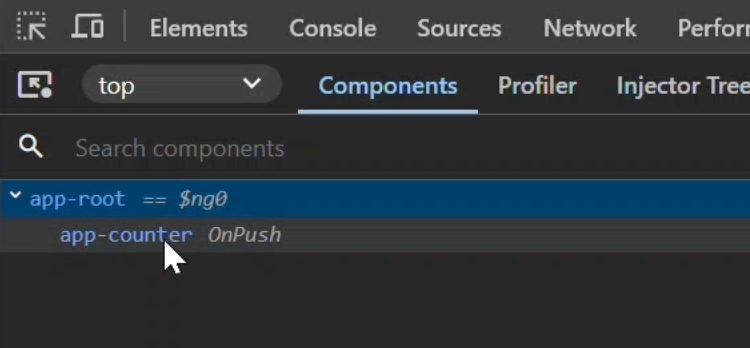
In this case it’s pretty easy, we only have the counter component, so we’ll select it.
Then we just need to click the “Show Signal Graph” button:
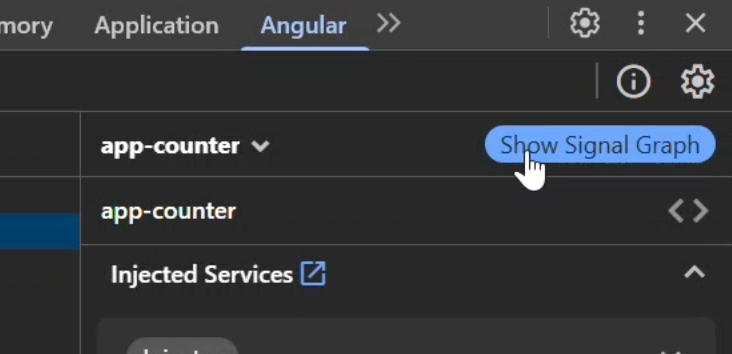
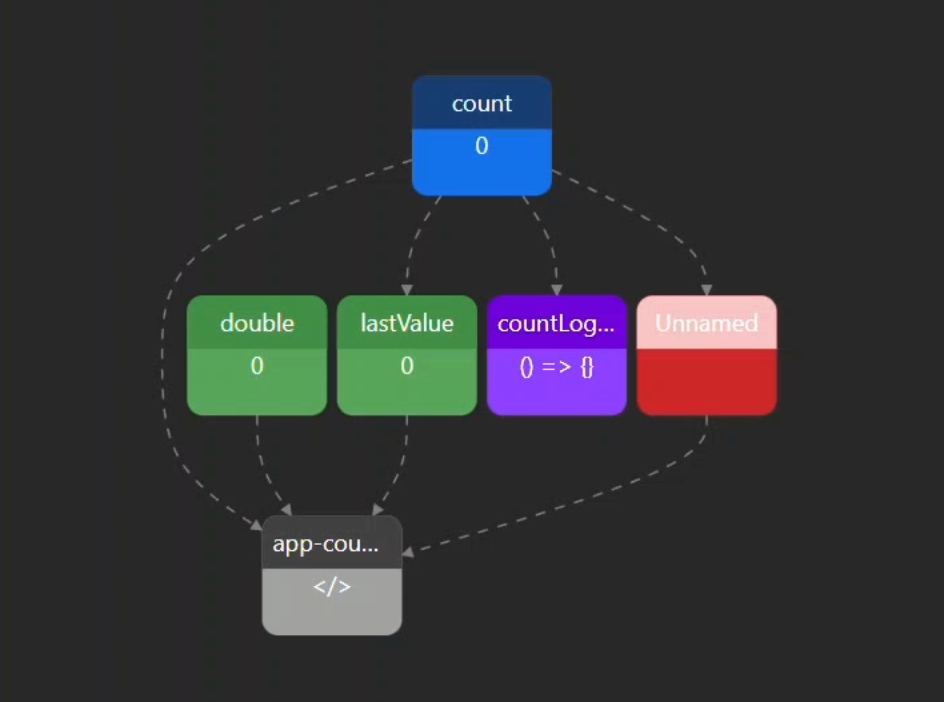
Now you’ll see a beautiful graph of all the signals in this component:
When we click the “+1” button, the signals light up, showing exactly what updates when we interact with our app:
Signal Types and Colors
You’ll notice that signals are shown in different colors:
- Blue → Writable signals (like the counter value).
- Green → Computed signals (values derived from others).
- Purple → Effects (side effects such as logging or API calls).
- Red → Linked signals (a writable signal derived from others).
- Gray → The template.
The lines between boxes represent data flow, like a family tree for your app’s state.
Explore Signal Details
Click on any signal to view more details:
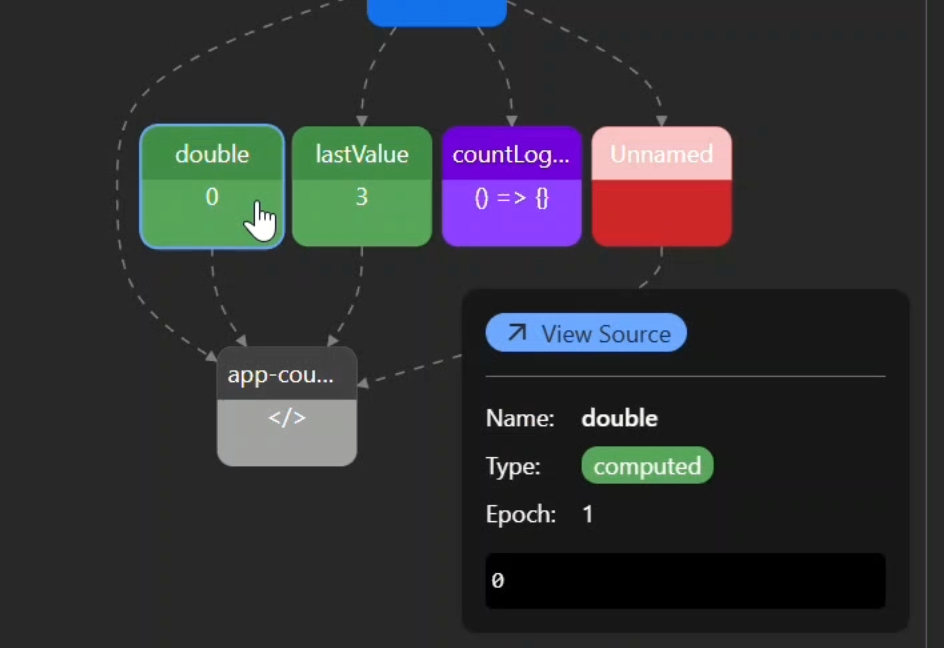
You can see the following details:
- Name → The name of the signal
- Type → signal, computed, effect, etc.
- Epoch → how many times it has changed since the app started
- Current value
Now, as you interact with the app, you can see both the “value” and the “epoch” updating in real time:
Spotting a Broken Signal
Here’s where Signal Graph shines.
You’ll notice that a computed “double” signal always stays at 0.
And in the graph, you don’t see a connection from “count” to “double”:
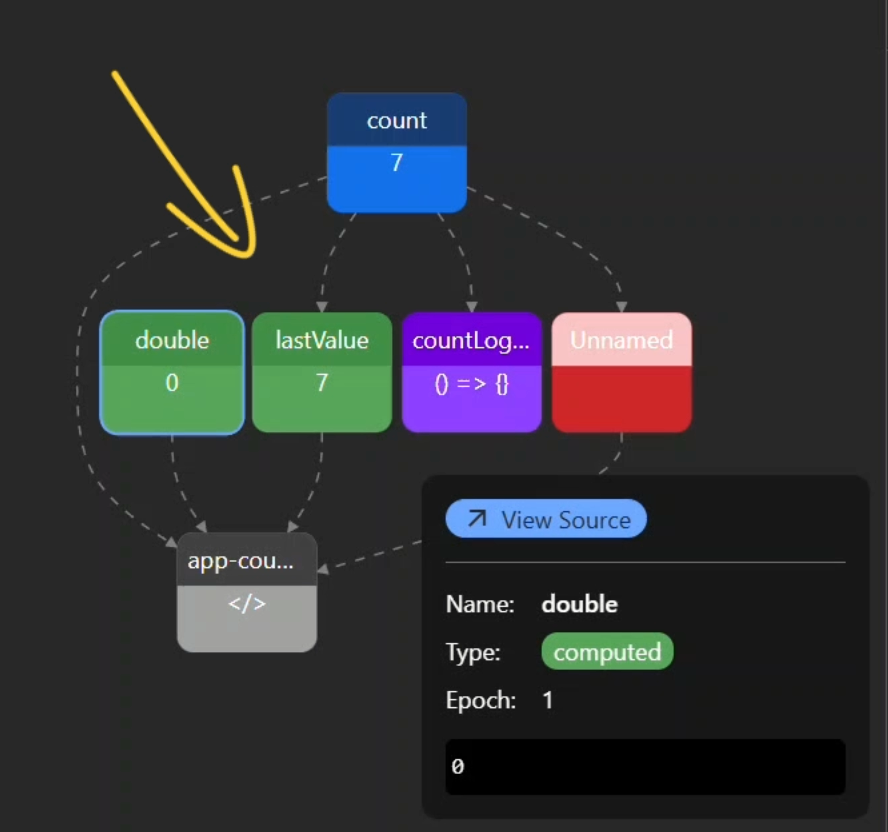
That missing connection is a red flag, the graph visually shows that the dependency isn’t wired correctly.
This makes it easy to spot bugs that would be frustrating to track down otherwise.
Fixing the Computed Signal
After checking the code, we find the culprit: instead of reading the “count” signal, the computed “double” was hardcoded with a 0:
export class CounterComponent {
    protected count = signal(0);
    ...
    protected double = computed(() => {
        const currentValue = 0; // This should be this.count()
        return currentValue * 2;
    });
}
By updating the code to properly read the “count” signal, we should be able to fix this:
export class CounterComponent {
    protected count = signal(0);
    ...
    protected double = computed(() => {
        const currentValue = this.count();
        return currentValue * 2;
    });
}
After saving, the Signal Graph now shows the connection between “count” and “double”:
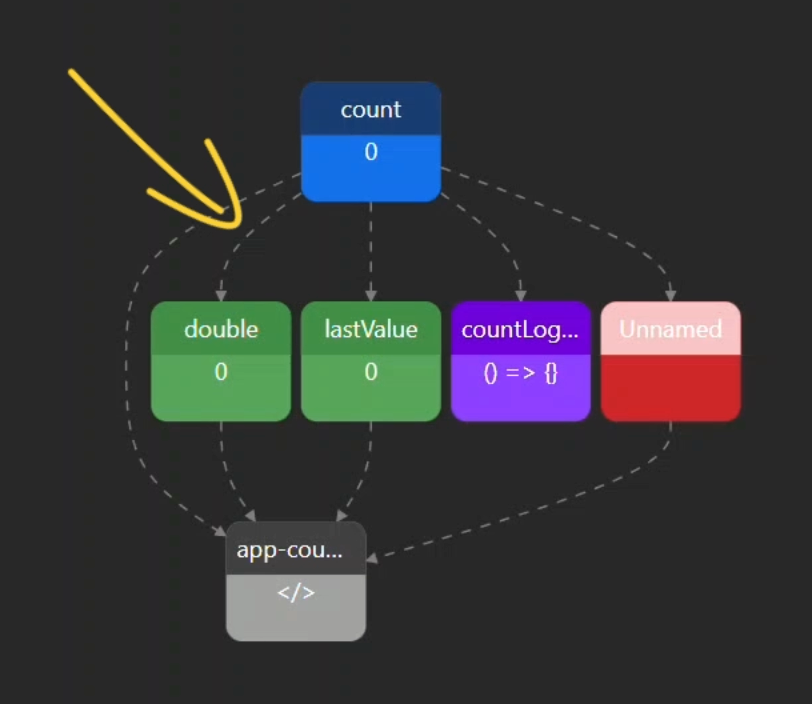
And then, when we click the button, both “count” and “double” light up, and the UI updates as expected:
Wrap-Up & Key Takeaways
And there it is, the Signal Graph turned debugging from guesswork into crystal-clear vision.
With it, we:
- Spotted a broken dependency.
- Fixed the bug.
- Instantly confirmed the results visually.
The more signals your app has, the more powerful this tool becomes.
So give it a try, it’s like switching on the lights in a dark room.
If this saved you some console.logs, don’t forget to subscribe for more Angular deep dives.