Find the Exact Slow Angular Component with Chrome DevTools
Chrome DevTools can tell us when an Angular component is slow. But if that component appears several times on the page, knowing the component type is only half the answer. Which instance is actually causing the problem? Angular's Chrome DevTools integration can now bridge that gap, letting us jump from a performance event directly to the exact component instance in Angular DevTools.
The Problem: One Component, Multiple Instances
For this example, we have a simple commerce dashboard with four metrics: Gross revenue, Orders, Conversion rate, and Average order value.
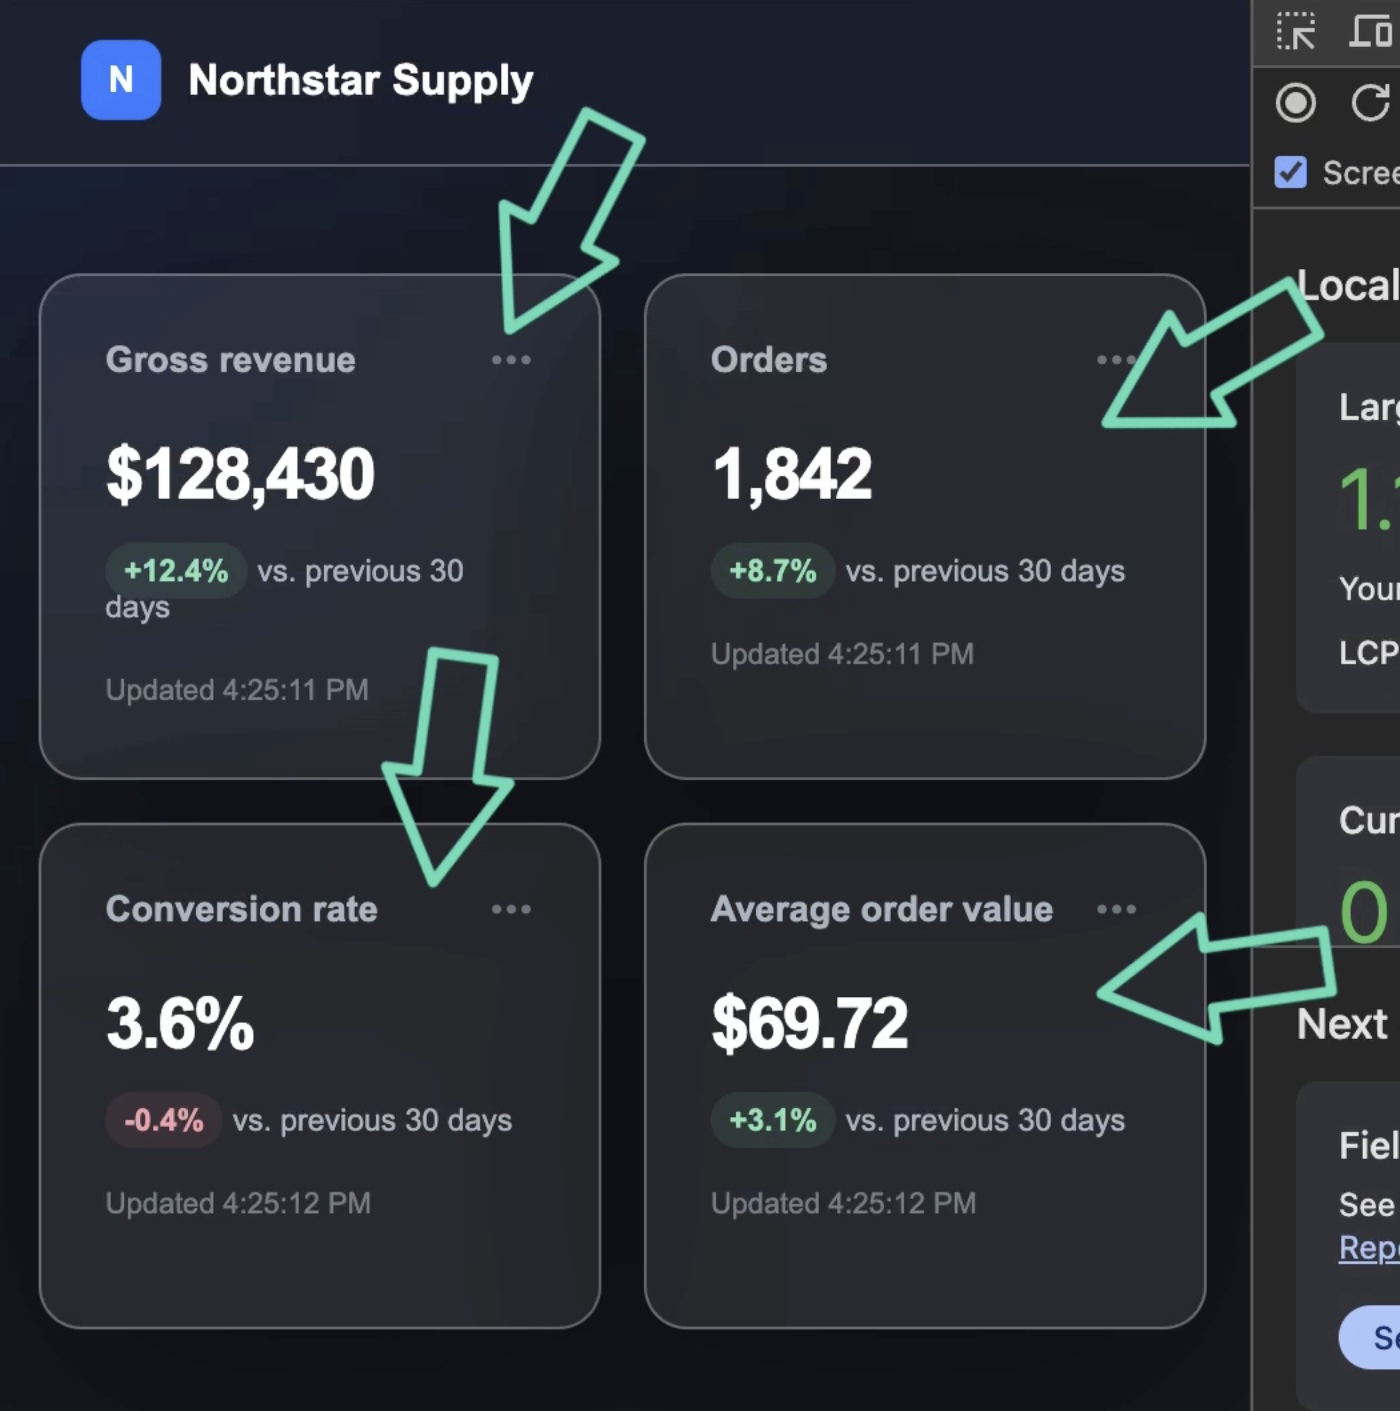
Every card uses the same ReportCard component:
<section class="card-grid" aria-label="Store metrics">
  @for (report of reports; track report.id) {
    <app-report-card
      [report]="report"
      [refreshCount]="refreshCount()"
    />
  }
</section>
The important part is that one instance (the Conversion rate card) is intentionally much slower than the others:
protected readonly reports: readonly ReportCardData[] = [
  {
    id: 1,
    name: 'Gross revenue',
    // ...
    delay: 2,
  },
  {
    id: 2,
    name: 'Orders',
    // ...
    delay: 2,
  },
  {
    id: 3,
    name: 'Conversion rate',
    // ...
    delay: 1000,
  },
  {
    id: 4,
    name: 'Average order value',
    // ...
    delay: 2,
  },
];
Inside the component, that delay deliberately blocks execution so the slow instance becomes obvious in a performance trace:
protected readonly lastUpdated = computed(() => {
  this.refreshCount();

  const end = performance.now() + this.report().delay;

  while (performance.now() < end) {
    // Deliberately block rendering so this component is visible in a trace.
  }

  return new Intl.DateTimeFormat('en-US', {
    hour: 'numeric',
    minute: '2-digit',
    second: '2-digit',
  }).format(new Date());
});
Obviously, we wouldn’t intentionally block the main thread like this in a real application.
It just gives us a predictable performance problem to investigate.
Finding the Slow Component in Chrome DevTools
With the Angular DevTools Chrome extension installed, we can open Chrome’s Performance panel, start a recording, and refresh the dashboard:
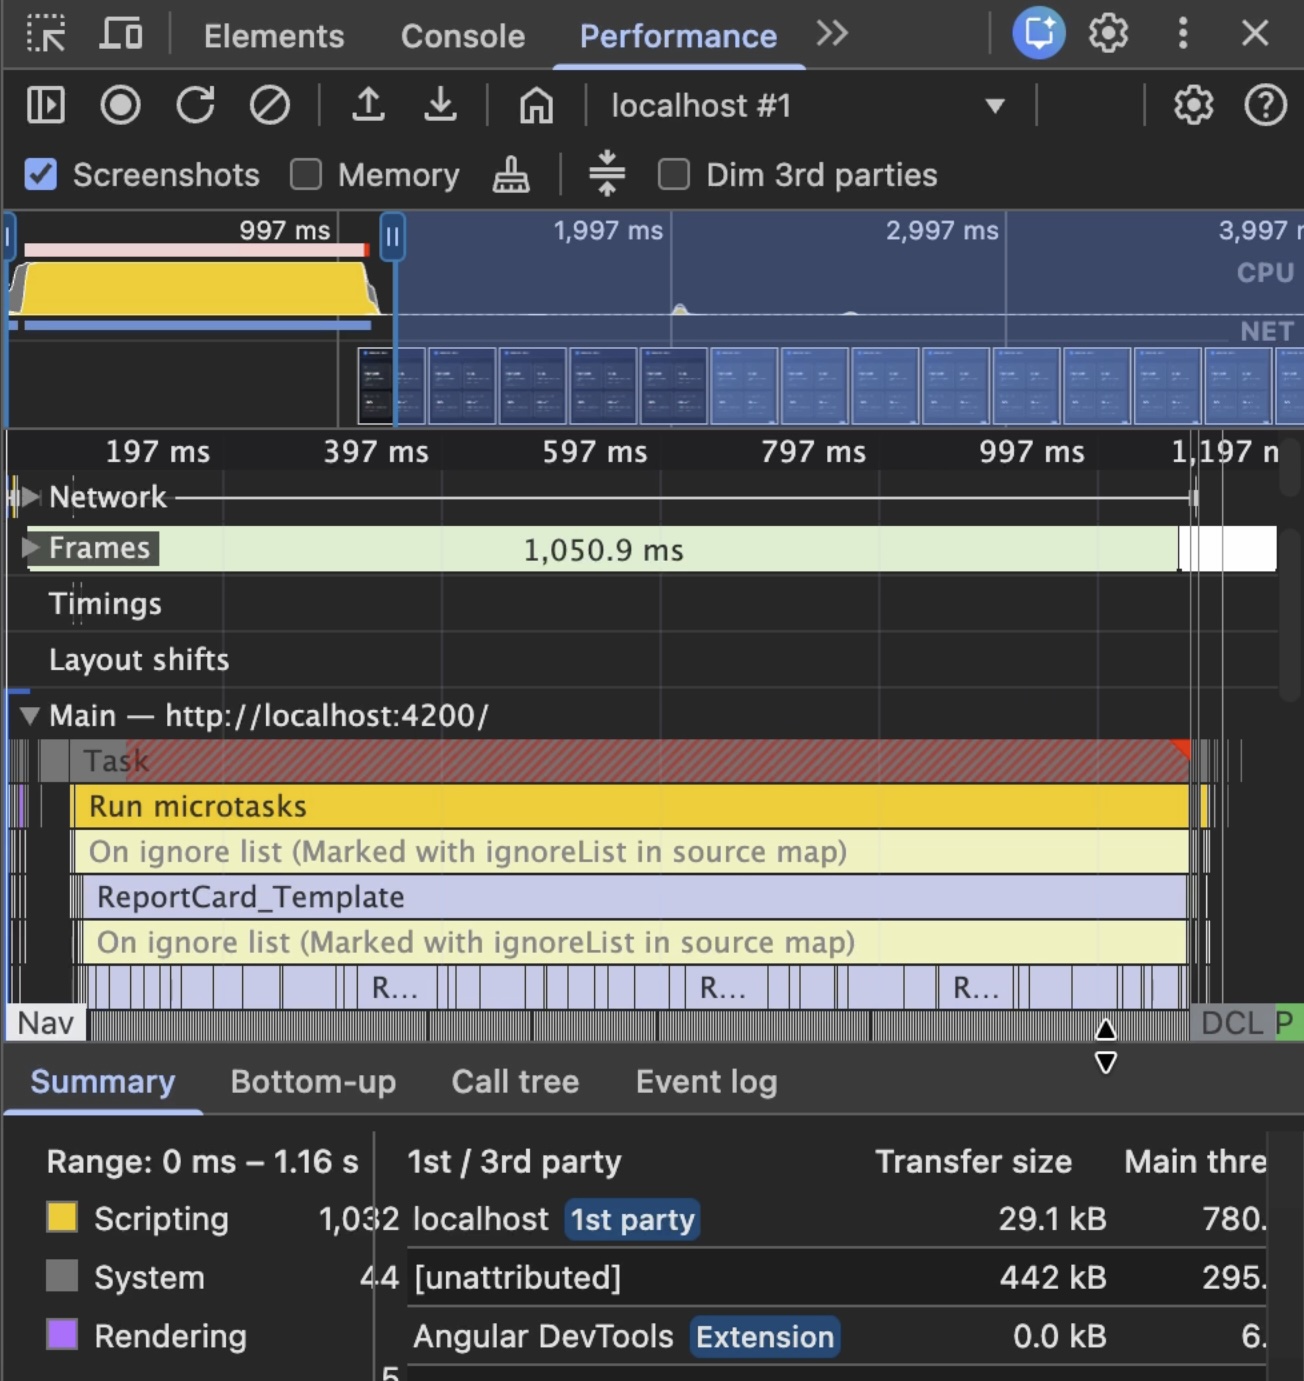
The resulting trace makes the problem pretty obvious.
There’s a long ReportCard change detection event taking roughly one second:
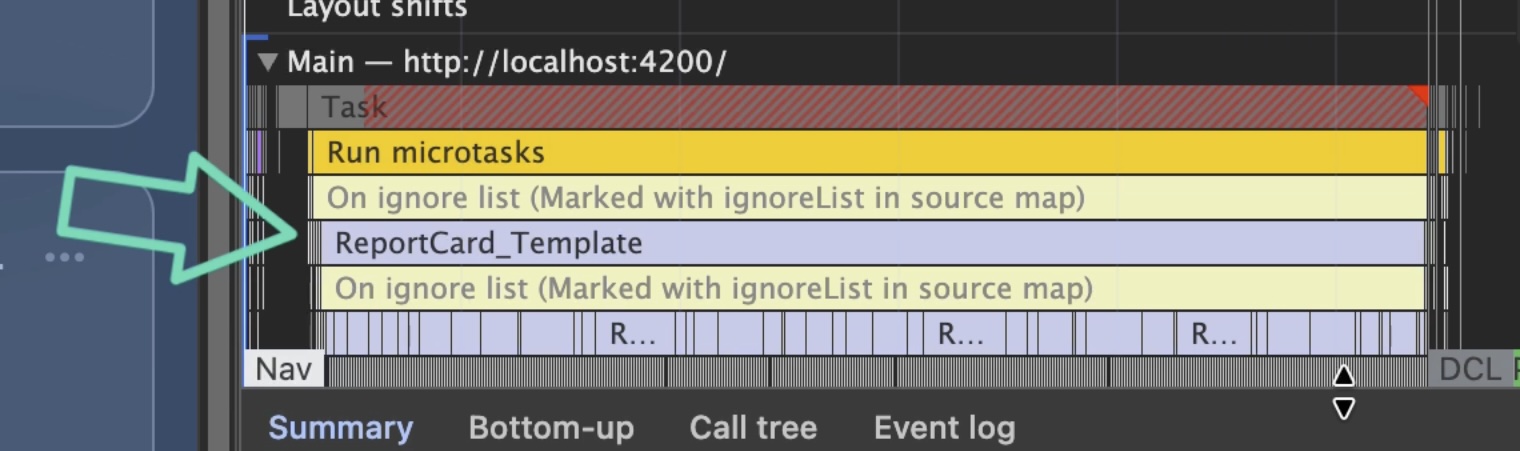
So we’ve found the slow component.
Sort of.
The dashboard contains four ReportCard instances.
The performance trace tells us that a ReportCard is slow, but we still need to figure out which one.
We could switch over to the Angular DevTools Components tab, find all four instances, and inspect their inputs individually:
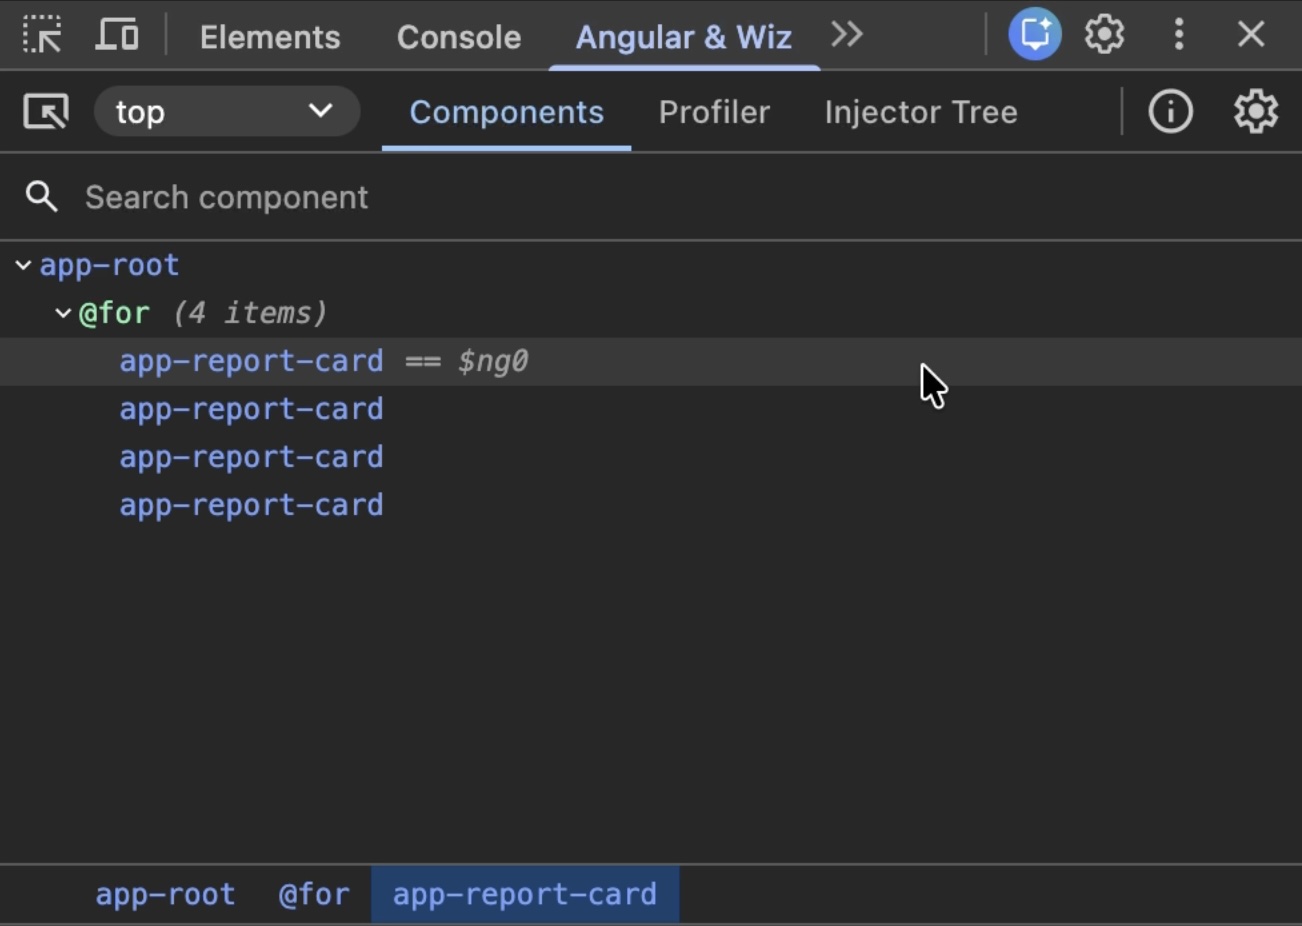
With four components, that’s a little inconvenient.
With dozens or hundreds of instances, it can become a serious debugging chore.
What we really want is a connection between the performance event and the exact component instance that generated it.
Enable Component Deep Links in Chrome
Before we can use that connection, Chrome currently requires an experimental flag.
In a chrome borwser instance, open:
chrome://flags/#enable-devtools-deep-link-via-extensibility-api
Then enable: Extensibility API support for deep-links within DevTools
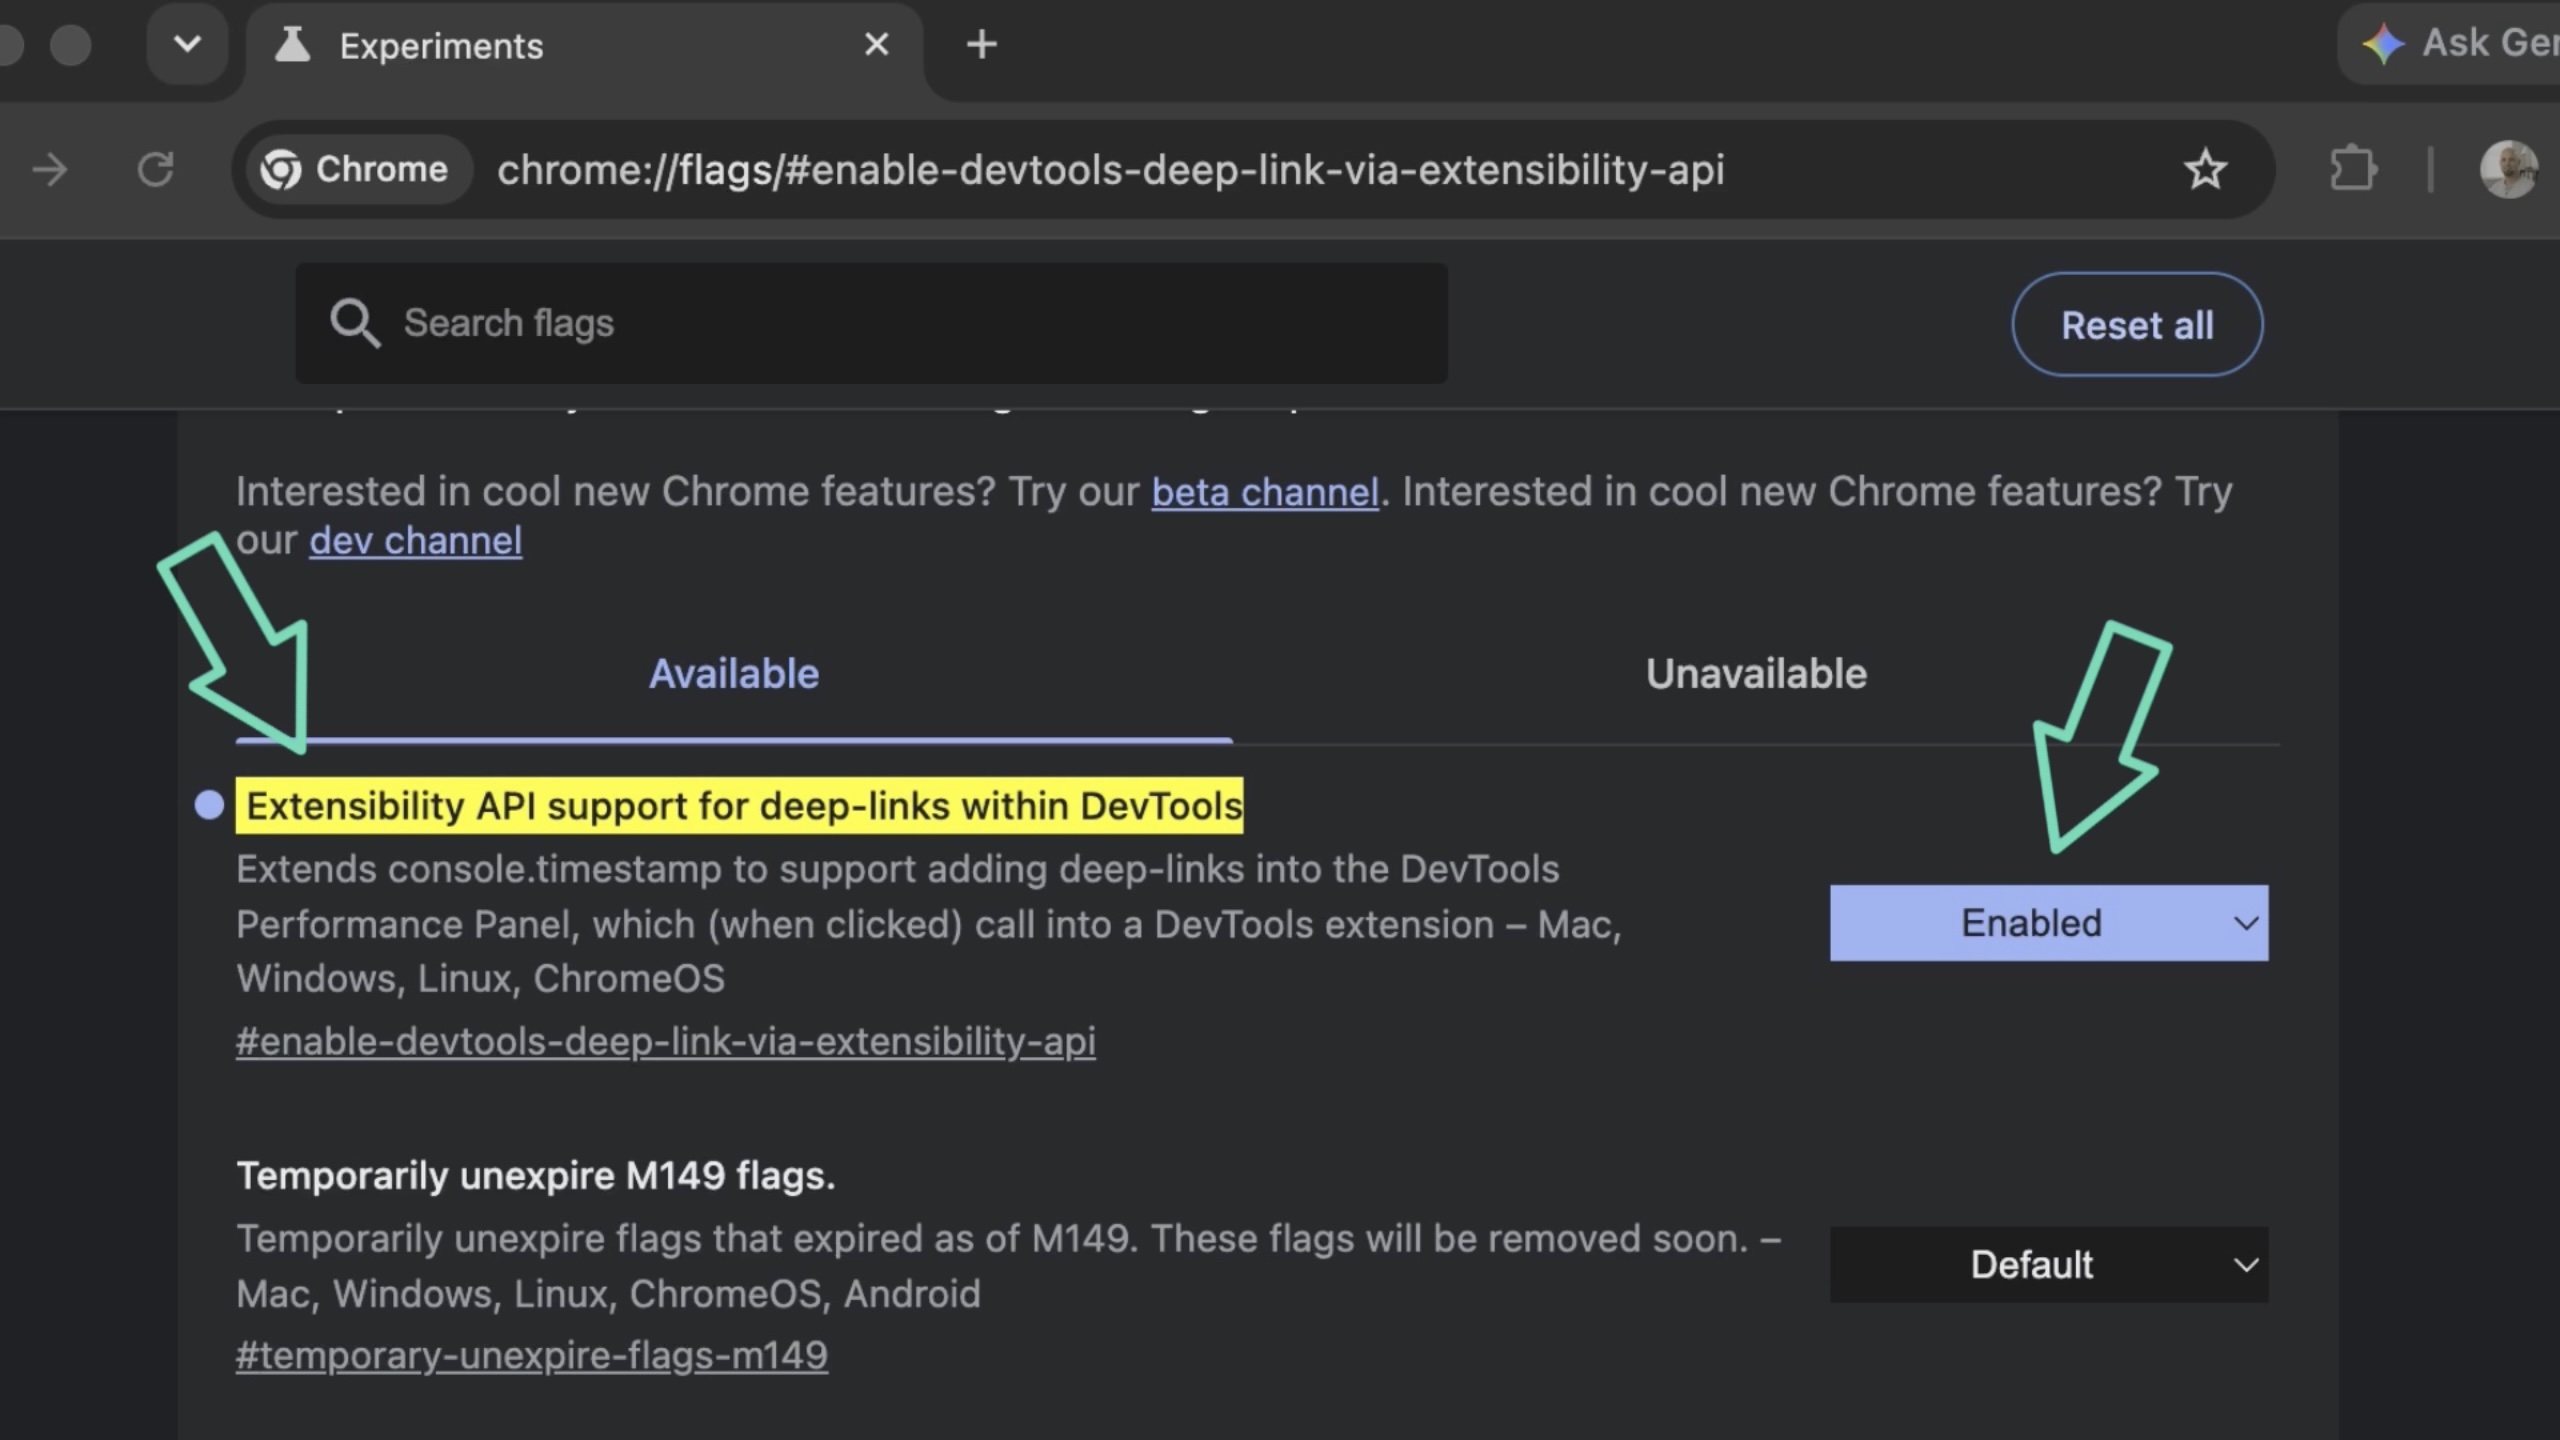
After changing the flag, you’ll need to completely relaunch Chrome.
Enable Angular Profiling
Next, we need Angular to contribute its own profiling events to Chrome’s Performance panel.
In the application entry point, import enableProfiling() from @angular/core:
import { enableProfiling } from '@angular/core';
import { bootstrapApplication } from '@angular/platform-browser';
import { appConfig } from './app/app.config';
import { App } from './app/app';

enableProfiling();

bootstrapApplication(App, appConfig)
  .catch((err) => console.error(err));
The important detail is that:
enableProfiling();
runs before:
bootstrapApplication(App, appConfig);
This allows Angular to capture profiling information from the beginning of the application lifecycle.
enableProfiling() is intended as a debugging tool and Angular’s profiling integration runs in development mode.
Angular Adds Its Own Performance Track
Now when we record another performance profile, we’ll see something different.
We have a new track:
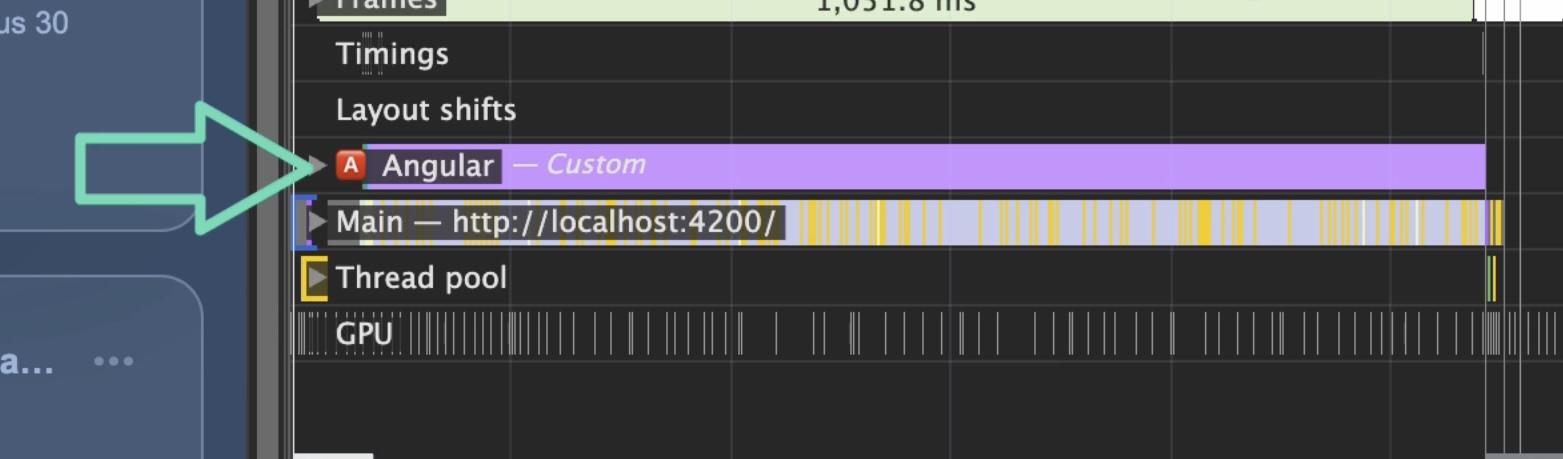
With profiling enabled, Angular itself contributes an additional Angular track containing framework-specific events for things like components, templates, lifecycle hooks, and change detection.
And this is where the new behavior becomes useful.
We can find the long-running ReportCard event again and select it:
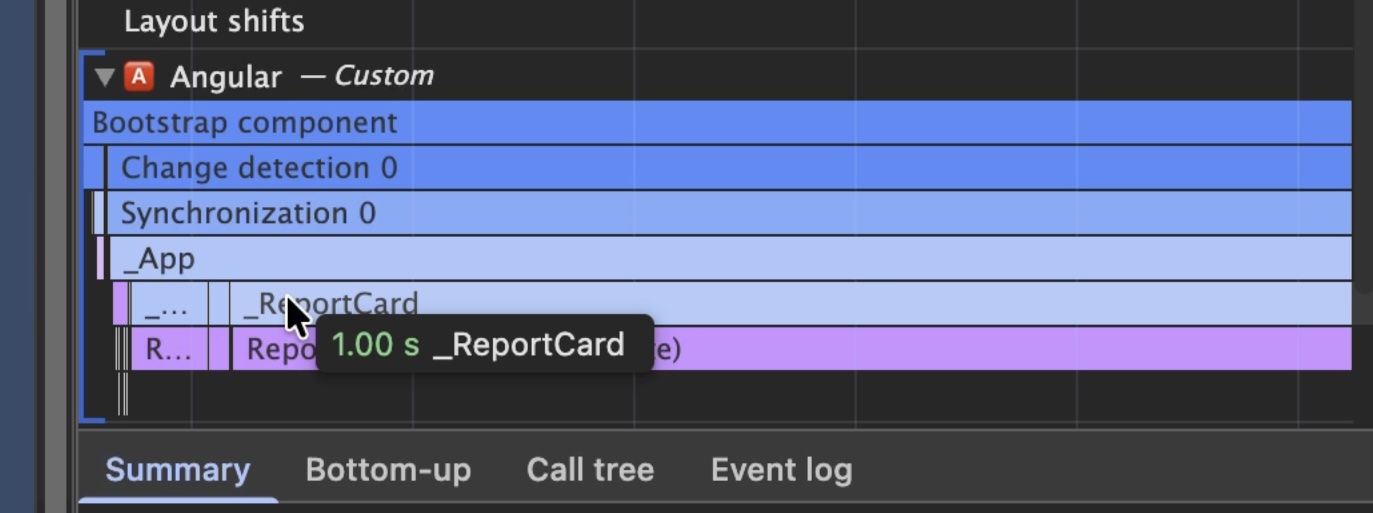
This time the Summary includes a component link:
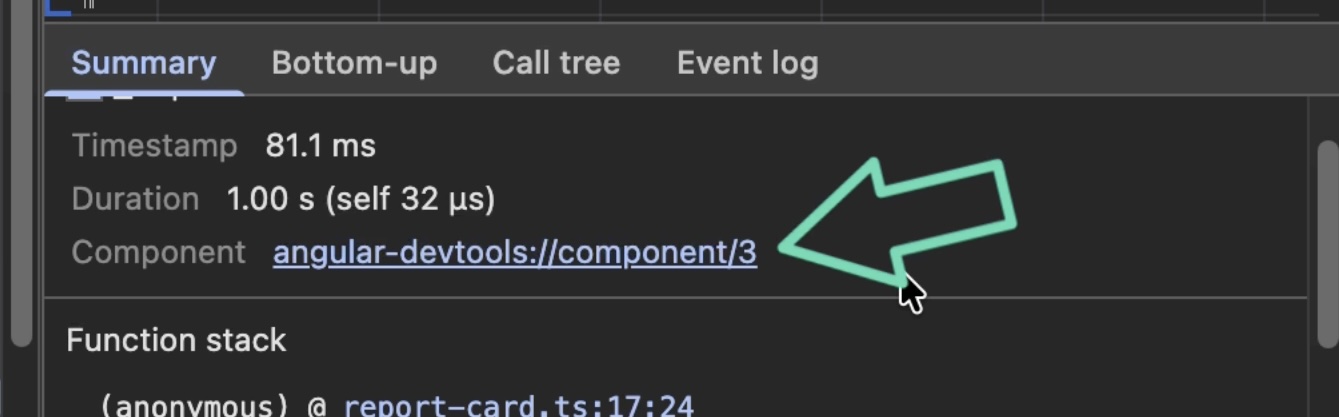
Jump Directly to the Slow Component
When we click the Component link, Angular DevTools opens its Components tab and selects the exact component instance associated with that performance event.
In our demo, we immediately land on the slow ReportCard instance, the Conversion rate card:
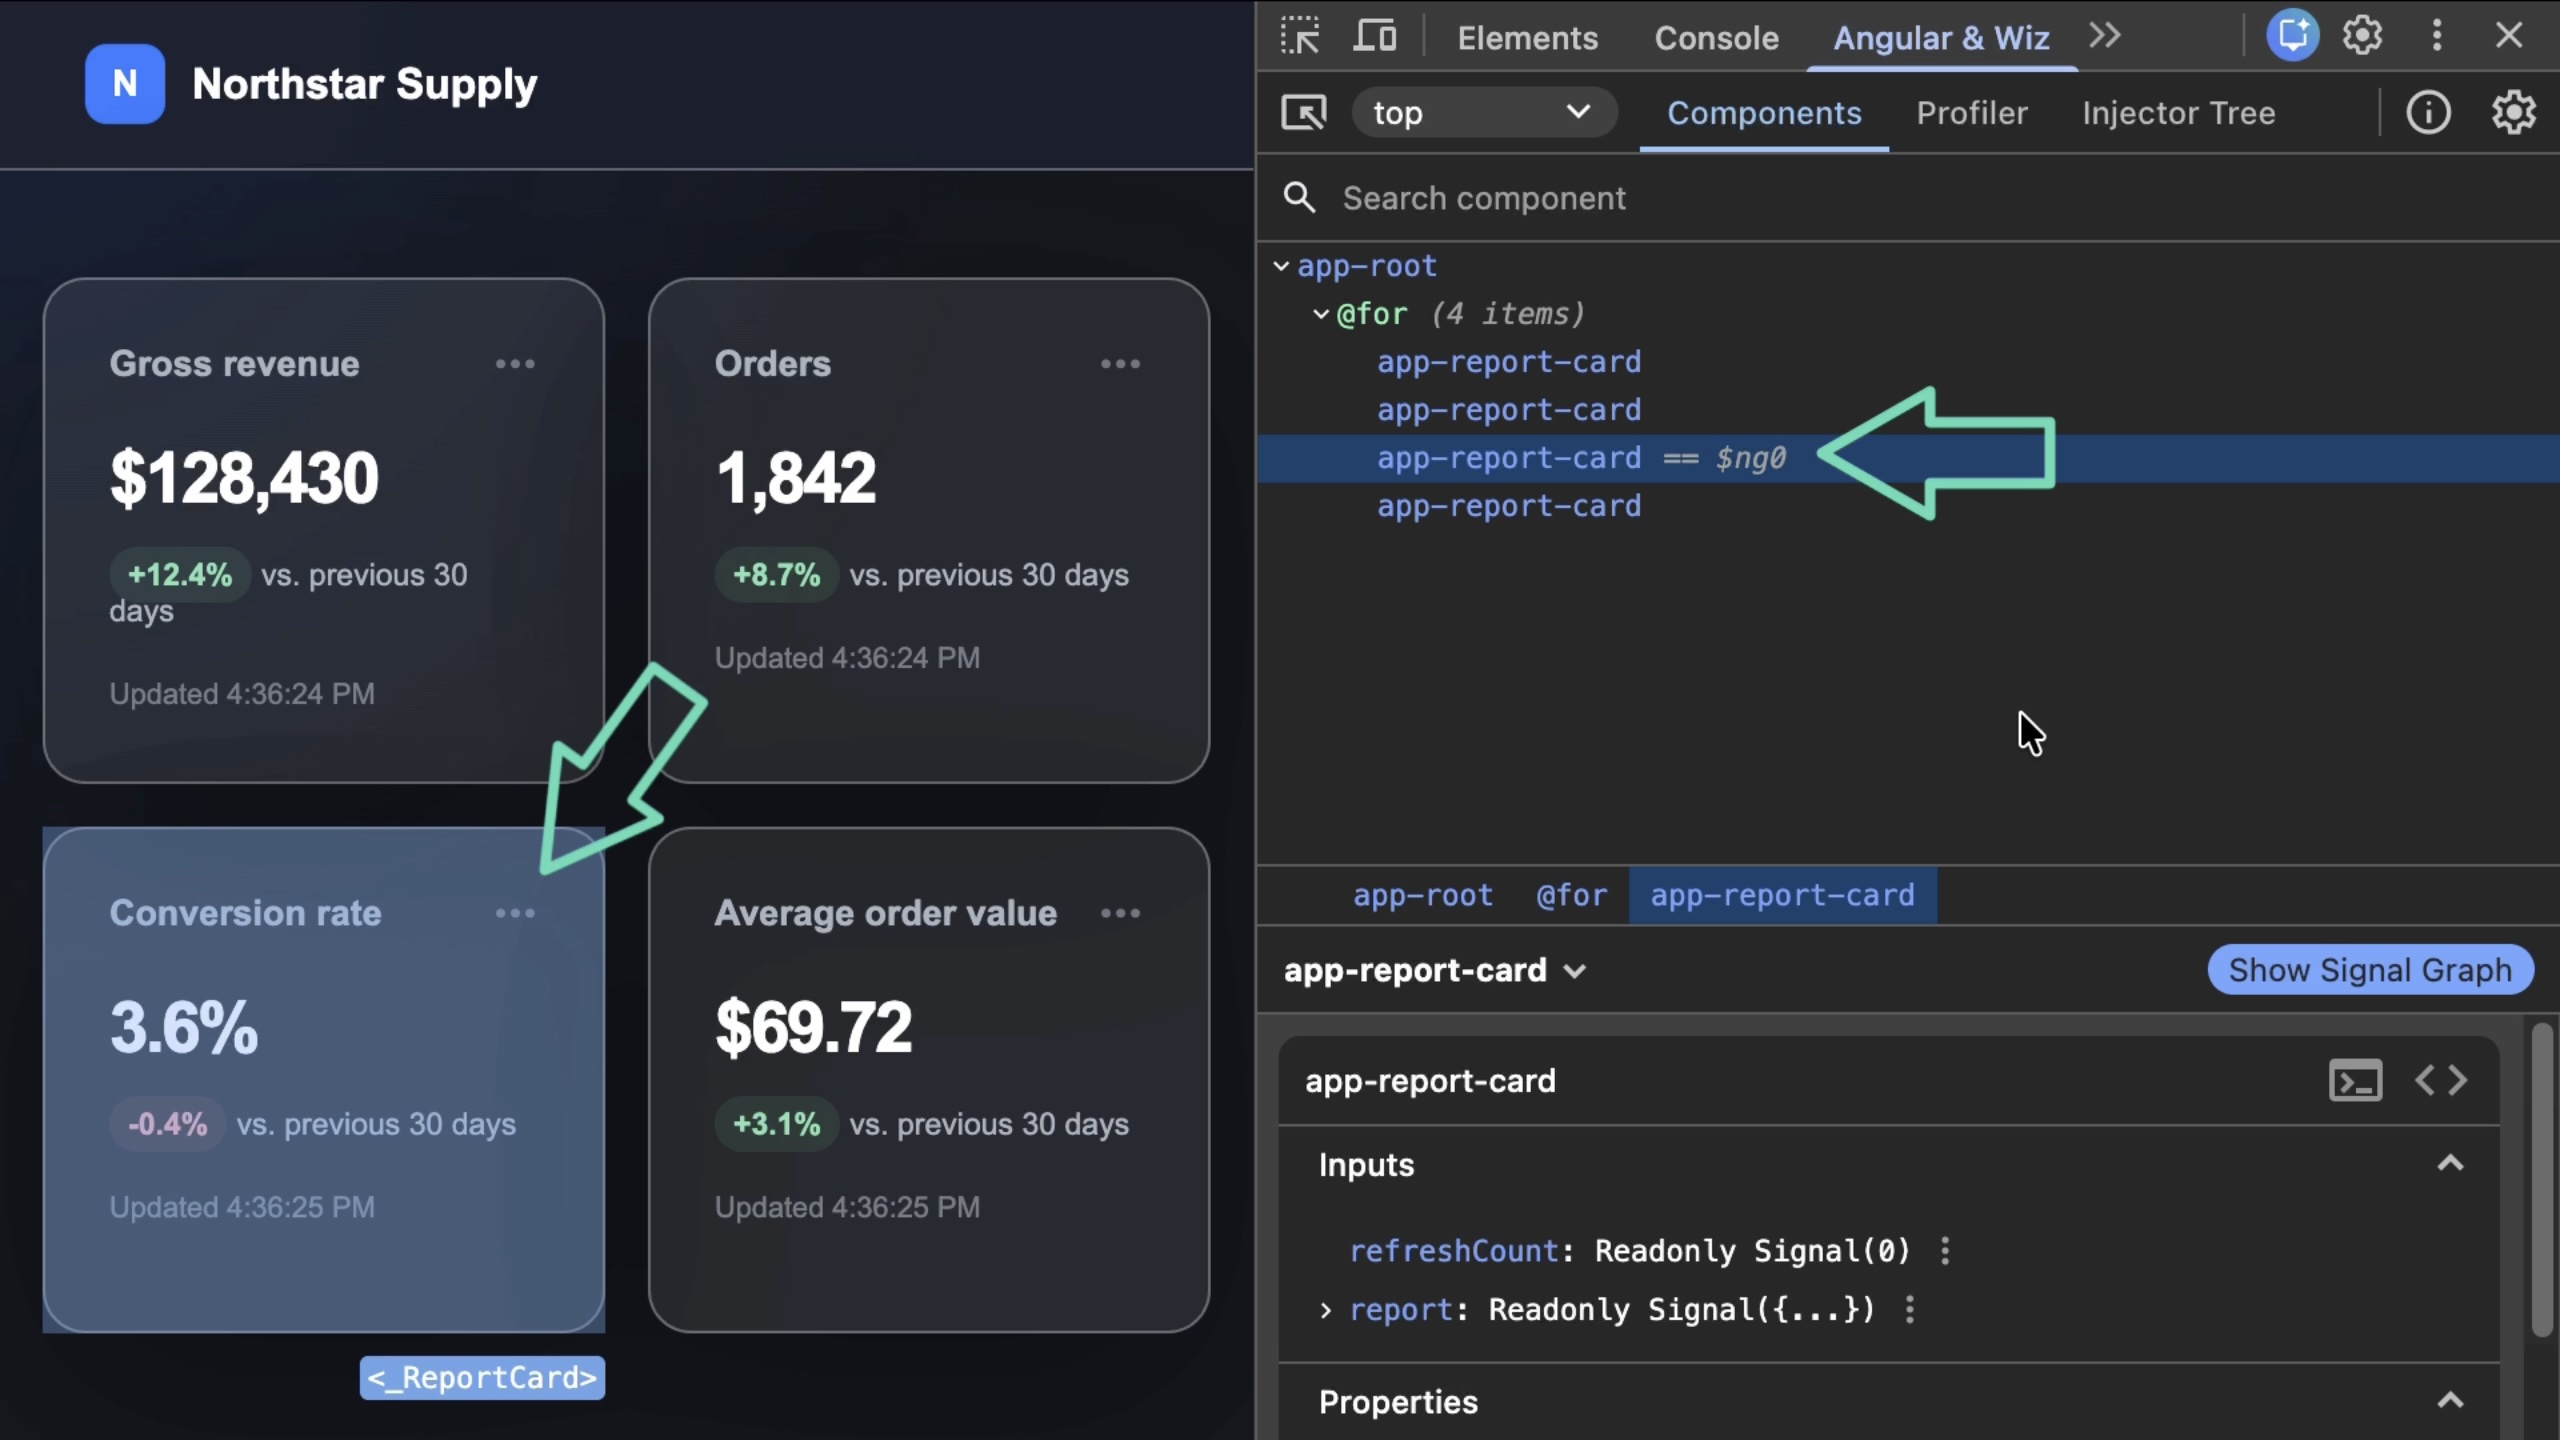
That’s the card with the one-second update.
There’s no searching through the component tree.
There’s no clicking through several identical component instances.
We move directly from this operation is slow, to this exact component instance caused it.
That’s a small workflow improvement that becomes increasingly useful as an application grows.
Final Thoughts
Chrome can tell us a component is slow. The Component link takes us to the exact instance that caused it.
It’s not a huge feature, but when that component appears dozens of times, it saves a lot of searching.
Get Ahead of Angular’s Next Shift
Angular’s newest APIs are changing the way we build.
If you’re ready to go deeper with one of the biggest shifts in modern Angular, my Signal Forms course will help you get comfortable with the new forms model.
You can access it either directly or through YouTube membership, whichever works best for you:
👉 Buy the course
👉 Get it with YouTube membership
Additional Resources
- The source code for this example
- Chrome Angular DevTools Extension
- Extensibility API support for deep-links within DevTools Flag
- Angular enableProfiling() API
- My course “Angular Signal Forms: Build Modern Forms with Signals”
- My course “Angular Application Styling”
- My course “Zoneless Change Detection in Angular”