Angular SVG Components: Create Dynamic Interactive Graphics
SVG components in Angular unlock powerful possibilities for data visualization and interactive graphics. Unlike static images, SVG components can respond to data changes, user interactions, and state updates in real time. This tutorial shows you how to transform basic lists into dynamic, interactive SVG charts using Angular's component system, signal-based reactivity, and template binding. You'll learn how to create scalable, data-driven visualizations that update automatically.
The Starting Point: Our Existing Component
The application that we’ll be working with is pretty straightforward.
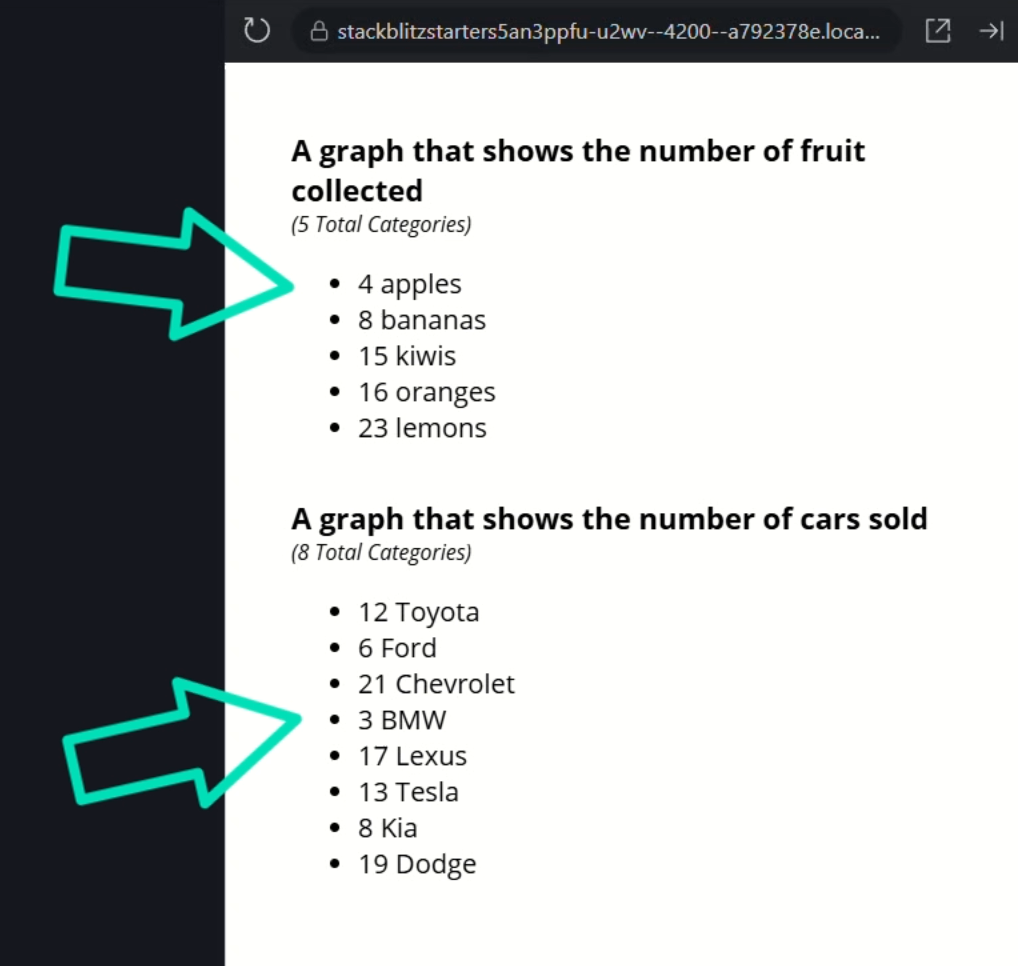
It has two different lists of data—one for “fruits collected” and another for “cars sold”:

We want to make this display more compelling by converting these lists into horizontal bar charts.
Understanding the App Component
Let’s look at the app component to better understand the current set-up.
In the template for this comonent, we have the code for the “fruits collected” section:
<h2>A graph that shows the number of fruit collected</h2>
<em>( Total Categories)</em>
<app-chart [chartItems]="fruit"></app-chart>
To display the list of data, we use a chart component.
This component receives an array of “ChartItem” objects as input:
fruit: ChartItem[] = [
    {
        count: 4,
        label: 'apples'
    },
    {
        count: 8,
        label: 'bananas'
    },
    {
        count: 15,
        label: 'kiwis'
    },
    {
        count: 16,
        label: 'oranges'
    },
    {
        count: 23,
        label: 'lemons'
    }
];
A similar setup is used for the “cars sold” section:
<app-chart [chartItems]="carsSold"></app-chart>
And the corresponding data:
carsSold: ChartItem[] = [
    {
        count: 12,
        label: 'Toyota'
    },
    {
        count: 6,
        label: 'Ford'
    },
    {
        count: 21,
        label: 'Chevrolet'
    },
    {
        count: 3,
        label: 'BMW'
    },
    {
        count: 17,
        label: 'Lexus'
    },
    {
        count: 13,
        label: 'Tesla'
    },
    {
        count: 8,
        label: 'Kia'
    },
    {
        count: 19,
        label: 'Dodge'
    }
];
Now, let’s look at the chart component.
The Chart Component
This component is quite simple.
It has a required input for the “chartItems” array:
chartItems = input.required<ChartItem[]>();
The template renders the items as a basic unordered list using a @for block:
<ul>
    @for (item of chartItems(); track item; let index = $index) {
        <li>
             {{ item.count }} {{ item.label }}
        </li>
    }
</ul>
So, very basic but that’s what we’re starting from.
Converting Angular Components from HTML to SVG
In this case, we want to transform the chart component into an interactive SVG-based bar chart.
So, we can do that by simply changing the file extension from .html to .svg.
Before:
chart.component.html
After:
chart.component.svg
Then, we need to update the “templateUrl” in the component’s metadata to point to the SVG file:
@Component({
    selector: 'app-chart',
    templateUrl: './chart.component.svg'
    ...
})
Now, we can replace the <ul> with an <svg> tag, and then add the SVG code for the dynamic bar chart:
<svg width="420" [attr.height]="20 * chartItems().length">
    @for (item of chartItems(); track item; let index = $index) {
        <g
            (click)="activeIndex.set(index)"
            [class.active]="activeIndex() === index">
            <rect
                [attr.width]="item.count * 10"
                height="19"
                [attr.y]="index * 20"></rect>
            <text
                [attr.x]="item.count * 10 + 5"
                [attr.y]="index * 20 + 15">
                {{ item.label }}
            </text>
        </g>
    }
</svg>
Explanation:
- Width and Height Binding: The width of the SVG is fixed at 420 units, and the height is dynamically calculated based on the number of items in the array.
- Bar Elements: Each bar is represented by a
<rect>element. The width is determined by multiplying theitem.countvalue by 10. - Labels: The labels are added using
<text>elements. Their position is calculated to be slightly to the right of each bar.
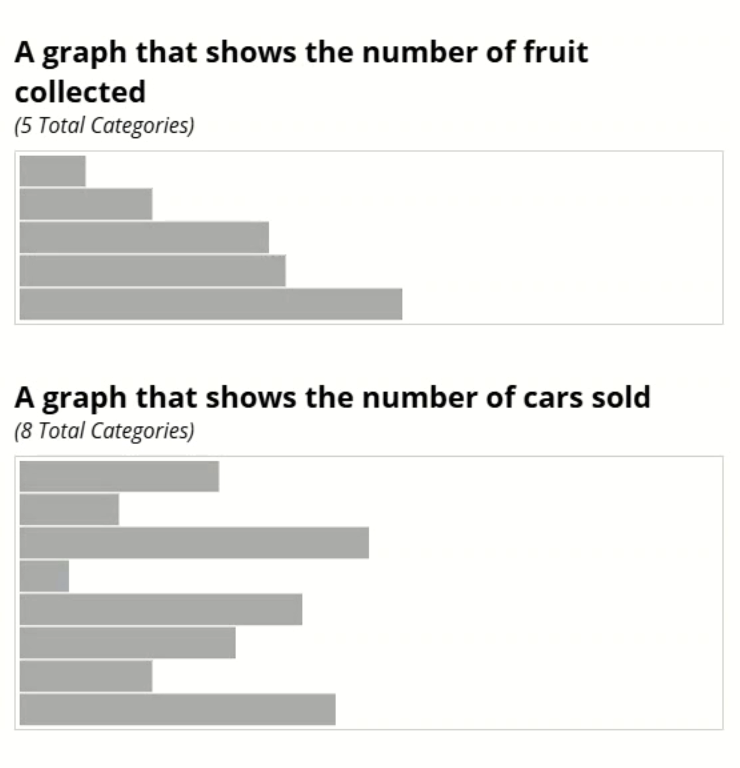
Save and refresh—we should now see dynamic bar charts!

This is pretty cool right?
We’re able to use traditional Angular features right within an SVG.
Enhancing the SVG with Angular Interactivity
Let’s take it even a little further now.
Let’s make things a bit more interactive by highlighting a bar when it’s clicked.
Let’s start by adding a signal to track the active index:
protected activeIndex = signal(-1);
Next, let’s use click event binding to update the active index on the SVG group elements:
@for (item of chartItems(); track item; let index = $index) {
    <g (click)="activeIndex.set(index)">
        ...
    </g>
}
Now, let’s use class binding to add an .active class to the bar when it’s clicked:
@for (item of chartItems(); track item; let index = $index) {
    <g
        (click)="activeIndex.set(index)"
        [class.active]="activeIndex() === index">
        ...
    </g>
}
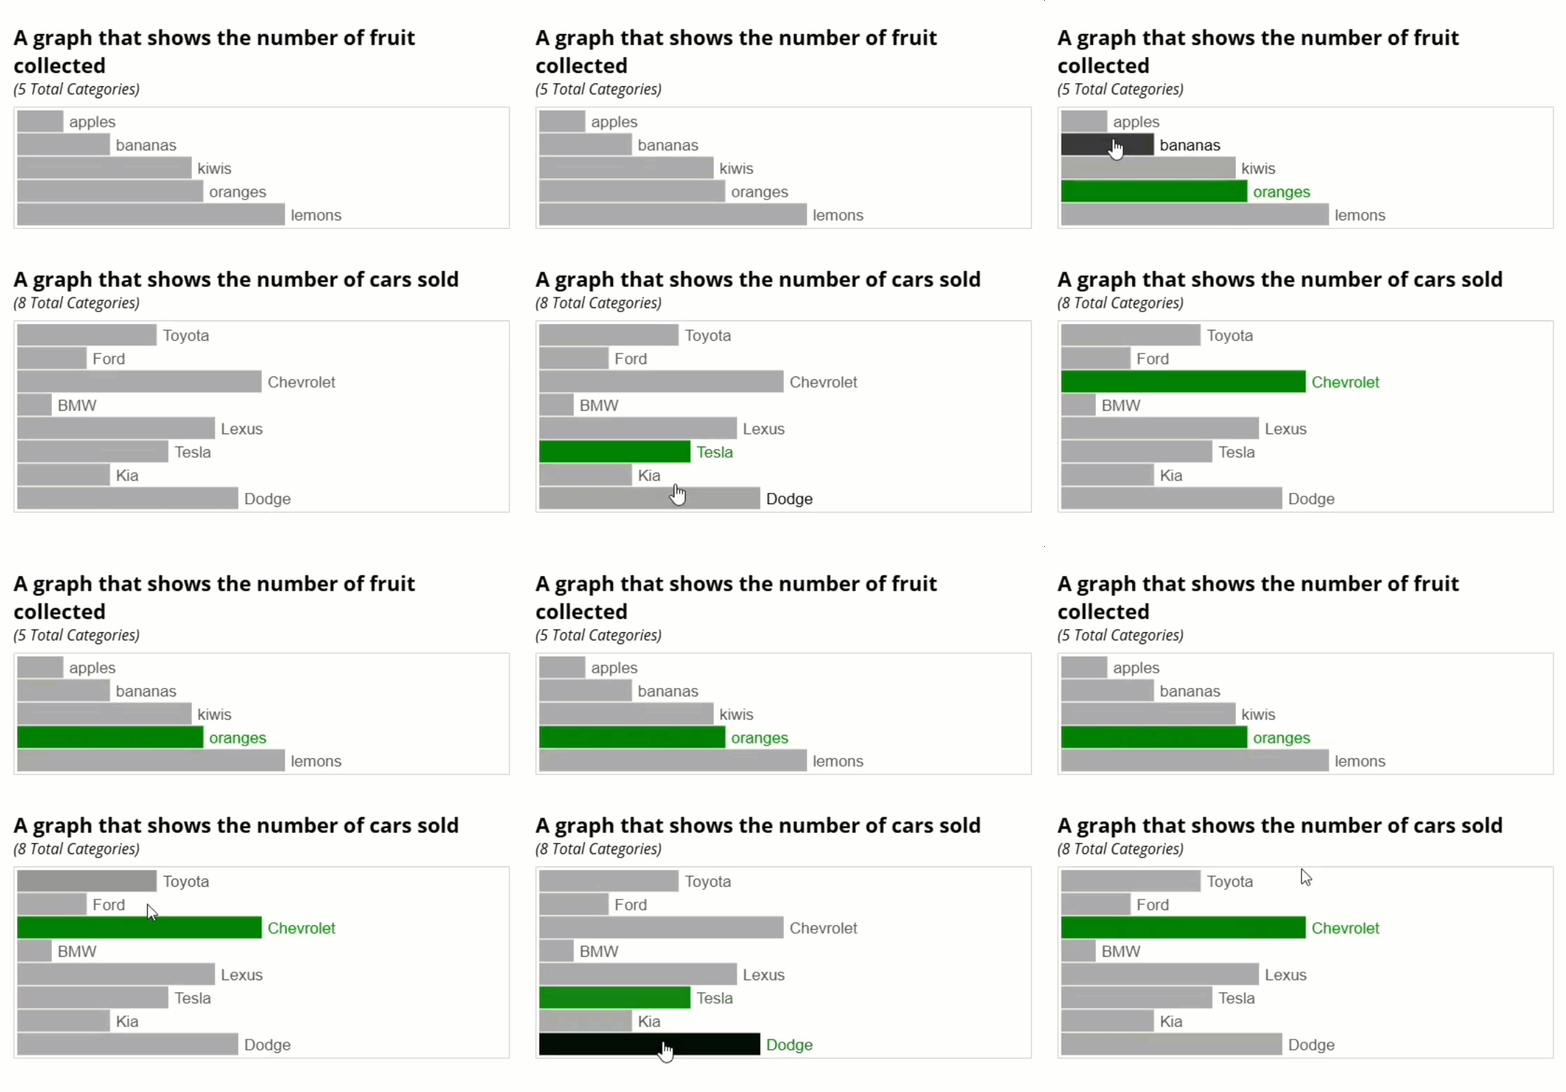
Now, when we click on a bar, it should turn green.
Likewise when we click on another bar, the previous one should turn back to its original color and the new one should turn green:

This simple feature adds a layer of interactivity, making the chart more engaging.
Conclusion
In this tutorial, we transformed basic lists into dynamic, interactive SVG bar charts.
We learned how to:
- Use an SVG as an Angular component template.
- Dynamically bind attributes.
- Add interactivity using Angular signals.
With these techniques, you can create engaging visualizations directly within your Angular apps.
If you found this tutorial useful, check out my other Angular tutorials for more tips and tricks!
Additional Resources
- The demo app BEFORE any changes
- The demo app AFTER making changes
- Angular Templates documentation
- A collection of Angular Signals tutorials
Want to See It in Action?
Check out the demo code and examples of these techniques in the Stackblitz example below. If you have any questions or thoughts, don’t hesitate to leave a comment.


