3 Ways to Add Dynamic CSS Custom Properties in Angular
Dynamic CSS custom properties enable data-driven styling in Angular components, allowing you to create responsive charts, themed components, and dynamic layouts based on runtime values. Angular provides multiple ways to set custom properties programmatically, each with different use cases and trade-offs. This tutorial compares three approaches: template style binding, Renderer2's setStyle method, and host element binding, helping you choose the right method for your scenario.
The Demo Application
In our demo application we have a chart component for displaying sales numbers by year. In this component, we have a @for loop iterating over a list of sales per year data.
sales-chart.component.html
@for (item of items; track item) {
<tr>
  <th scope="row">{{ item.year }}</th>
  <td>
    <span> {{ item.total }} </span>
  </td>
</tr>
}
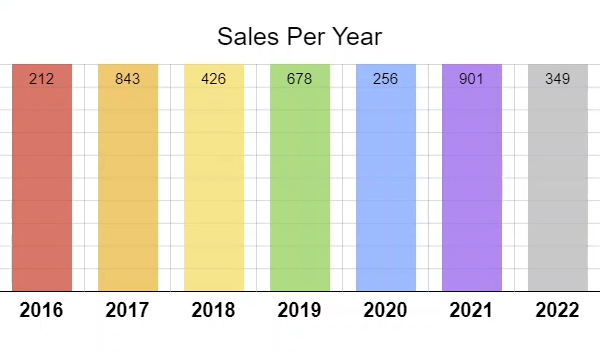
For each year, we have a row of data but, there’s a problem with the way this data is displayed currently. The bar for each year is the same height even though the data is different.

Well, this is what we’re going to fix.
To make things easier, we’re using the open-source data visualization library, Charts.css. So, we don’t need to worry about adding our own styles for the chart. This library uses HTML tables and provides several classes to style the chart as needed.
sales-chart.component.html
<table
  class="
        charts-css
        column
        show-heading
        show-labels
        show-primary-axis
        show-data-axes
        show-10-secondary-axes
        data-spacing-10"
>
  ...
</table>
But it’s our job to provide our own custom data, and when we provide our data, we also need to supply the height for each bar in the chart using a “–size” custom property. This custom property needs to be set as a decimal value so we’ll need to use a JavaScript math equation to programatically set it based on the data provided.
Using Style Binding in the Component Template
One way to do this is to use basic style binding on the table cell for the bar to bind the custom property directly on this element. To this we start by adding square brackets to bind to the style attribute. Then we add a dot, followed by the “–size” custom property.
Then we just need to provide our math equation to create our decimal value. This equation will take the item total and divide it by the “maxSalesCount”. This is the top value for our chart and in this case it’s set to one thousand.
sales-chart.component.html
<td [style.--size]="item.total / maxSalesCount">
  <span> {{ item.total }} </span>
</td>
Ok, that should be all we need, so let’s save and see how it looks.

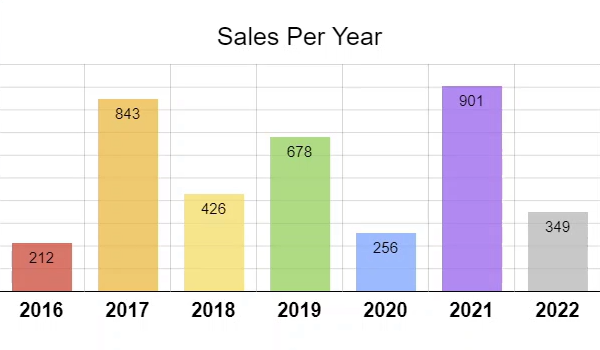
There, that’s better. Now we have the proper heights for each of the bars in the chart.
Using the Renderer2 setStyle() Method with RendererStyleFlags.DashCase
Another way we can programmatically bind custom properties in Angular is to use the Renderer2 class setStyle() method along with the DashCase flag.
For this example, we’ll instead switch over to use an existing chart row component for each of the rows in the list. First we’ll need to import it in our sales chart component.
sales-chart.component.ts
import { SalesChartRowComponent } from "./sales-chart-row/sales-chart-row.component";

@Component({
    selector: 'app-sales-chart',
    ...
    imports: [
        SalesChartRowComponent
    ]
})
Ok, now we can switch back to the template and remove the th and td within the @for loop since these are now going to be included in the template for the row component. This component uses an attribute “appSalesChartRow” for its selector, so we’ll need to add that on the tr.
sales-chart.component.html
@for (item of items; track item) {
<tr appSalesChartRow></tr>
}
Now this component has two required inputs, one for the max sales count which we can bind to our “maxSalesCount” property, and another for our item which we can bind to our item from the @for loop.
sales-chart.component.html
@for (item of items; track item) {
<tr appSalesChartRow [maxSalesCount]="maxSalesCount" [item]="item"></tr>
}
Now at this point, if we save, we’ll see our chart bars are not getting the correct height style applied anymore.

This is because we now need to set the custom property within our new row component. So, let’s switch over to the code for this component and set this custom property with the Renderer2.
The first thing we need to is get a handle to the HTML element that we want to add the style to. So let’s create a protected field called “bar”. This element will be within what is considered the “view” for our component so we’ll use a viewChild() signal query typed as an ElementRef. And then we’ll look for a reference variable with the name “bar”.
sales-chart-row.component.ts
import { ..., viewChild } from "@angular/core";

@Component({
  selector: '[appSalesChartRow]',
  ...
})
export class SalesChartRowComponent {
    protected bar = viewChild<ElementRef>('bar');
}
Ok, now let’s switch to the template and add this reference variable.
sales-chart-row.component.html
<td #bar>...</td>
Ok, now let’s switch back to the TypeScript for this component.
Next we need to add a constructor. In the constructor we need to inject in the Renderer2 class, so we’ll add a field named “renderer” and then we’ll add the Render2 class.
sales-chart-row.component.ts
import { ..., Renderer2 } from "@angular/core";

@Component({
  selector: '[appSalesChartRow]',
  ...
})
export class SalesChartRowComponent {

    constructor(renderer: Renderer2) {
    }

}
Ok, now we can use the renderer to add this custom property style. We will need to wait until we have access to the bar viewChild(), so we’ll use an effect() for this. Then within this effect(), we’ll use the renderer property that we added to call the setStyle() method.
The first parameter this function needs it the element to add the style to, so we’ll add our bar viewChild() and then access its nativeElement. Then, for the second parameter, we need to provide the style we’re going to set as a string. So, in this case, it’ll be our “–size” custom property. For the third parameter, we need to provide the value for this style which will be our math equation again, the item total divided by the “maxSalesCount” input.
Since we’re adding a custom property, we need to provide a special flag to the setStyle() method as the fourth parameter. We need to use the RendererStyleFlags2 enum to access the DashCase flag value. Now this flag is only needed because we are setting a custom property which starts with dashes. If we were binding to a known style property like color, height, width, or something along those lines, we wouldn’t need this flag.
sales-chart-row.component.ts
import { ..., RendererStyleFlags2 } from "@angular/core";

@Component({
  selector: '[appSalesChartRow]',
  ...
})
export class SalesChartRowComponent {

    constructor(renderer: Renderer2) {
        effect(() => {
            renderer.setStyle(
                this.bar()?.nativeElement,
                '--size',
                this.item().total / this.maxSalesCount(),
                RendererStyleFlags2.DashCase);
            );
        });
    }

}
Now let’s save again and see how we did.

Nice, now we have the correct styles again.
So, that’s another possibility for programmatically setting custom properties. If style binding doesn’t work for you, maybe this renderer concept will.
Using Style Binding on the Component with Host Element Binding
Now, for this chart example, we have another possibility too. Since CSS custom properties cascade, we can bind it on our component host element and this should provide the proper value to the Charts.css library.
To do this, we’ll want to remove all of the stuff we just added for the renderer concept including the constructor, renderer, effect, viewChild(), all the unused imports, and the “bar” template reference variable too.
Then, to bind to the host element, we’ll add the host object in the component metadata.
sales-chart-row.component.ts
@Component({
  selector: '[appSalesChartRow]',
  ...,
  host: {}
})
From here it’ll look a lot like the first style binding example. We’ll use square brackets to bind to the style attribute, then we we’ll add a dot, and then our “–size” custom property. Then we can provide the value using our same math equation again, the item total by the “maxSalesCount”.
sales-chart-row.component.ts
@Component({
  selector: '[appSalesChartRow]',
  ...,
  host: {
    '[style.--size]': 'item().total / maxSalesCount()'
  }
})
Ok, that’s it, so let’s save and see how it looks.

Nice it looks like it’s supposed to so that means that our style is getting added properly on the host element and then cascading down just like we need it to.
In Conclusion
Ok, so this isn’t necessarily something that you’ll need very often, but now at least you have a few different ways to programmatically set dynamic custom properties if and when you need to.
I hope you found this tutorial helpful, and if you did, check out my YouTube channel for more tutorials about various topics and features within Angular.
Additional Resources
- CSS Custom Properties
- Angular Renderer2 setStyle() Documentation
- Angular Style Binding Documentation
- Angular Host Elements Documentation
- Charts.css Data Visualization Framework
Want to See It in Action?
Check out the demo code and examples of these techniques in the Stackblitz example below. If you have any questions or thoughts, don’t hesitate to leave a comment.


